Tools for embedded memory footprint tracking with real-world project examples
Embedded systems operate under strict constraints: low power, limited memory, constrained CPU resources, and often hard real-time requirements. On top of that, embedded software is expected to meet high reliability standards, frequently in safety-critical or always-on environments. Unlike general-purpose software development, firmware often lacks many of the safeguards we take for granted: such as user space and kernel space distinction and memory management.
This article focuses specifically on memory constraints, and reviews the tools and practices used to profile, analyze, and track firmware memory footprint over time.
Scope
This article focuses on firmware that is built into the ELF (Executable and Linkable Format).
Most embedded toolchains produce an ELF file as an intermediate artifact, which is then converted into a raw memory image and flashed onto the target device.
The ELF format is particularly useful because it contains rich metadata: memory sections, symbol names, addresses and sizes (functions, constants, and variables), and optional debug symbols data (DWARF) that in this context are relevant for mapping symbols to their definitions in the source code.
Profiling tools can extract this information directly from the ELF for detailed memory analysis.
We also discuss linker scripts, which are critical for understanding memory region limits (for example, Flash and RAM sizes). These limits are typically defined in linker scripts and are not stored in the ELF file itself.
Profiling Tools
Binutils (nm, readelf, objdump, size)
These are fundamental tools for firmware profiling. They operate directly on ELF files and produce textual reports showing symbol sizes, section layouts, and overall memory usage.
$ size firmware.elf
   text    data     bss     dec     hex filename
 365192      52   26908  392152   5fbd8 firmware.elf
However, they do not analyze linker scripts, so they cannot determine how much memory remains available in each region. Comparisons of memory layouts or extracting actionable insights typically requires manual investigation and additional custom scripting.
Linker map files (-Map or --map)
Some toolchains allow generating a linker map file during the build. This textual output describes the full memory layout, including symbols, sections, and memory regions.
The map files give very detailed information, but can be complex to understand and get insights from.
Bloaty 
Bloaty is a powerful binary size analysis tool that supports multiple formats, including ELF. It can attribute memory usage to compile units, sections, and individual symbols.
$ ./bloaty bloaty -d compileunits
    FILE SIZE        VM SIZE
 --------------  --------------
  34.8%  10.2Mi  43.4%  2.91Mi    [163 Others]
  17.2%  5.08Mi   4.3%   295Ki    third_party/protobuf/src/google/protobuf/descriptor.cc
   7.3%  2.14Mi   2.6%   179Ki    third_party/protobuf/src/google/protobuf/descriptor.pb.cc
   4.6%  1.36Mi   1.1%  78.4Ki    third_party/protobuf/src/google/protobuf/text_format.cc
   3.7%  1.10Mi   4.5%   311Ki    third_party/capstone/arch/ARM/ARMDisassembler.c
   1.3%   399Ki  15.9%  1.07Mi    third_party/capstone/arch/M68K/M68KDisassembler.c
   3.2%   980Ki   1.1%  75.3Ki    third_party/protobuf/src/google/protobuf/generated_message_reflection.cc
   3.2%   965Ki   0.6%  40.7Ki    third_party/protobuf/src/google/protobuf/descriptor_database.cc
   2.8%   854Ki  12.0%   819Ki    third_party/capstone/arch/X86/X86Mapping.c
   2.8%   846Ki   1.0%  66.4Ki    third_party/protobuf/src/google/protobuf/extension_set.cc
   2.7%   800Ki   0.6%  41.2Ki    third_party/protobuf/src/google/protobuf/generated_message_util.cc
   2.3%   709Ki   0.7%  50.7Ki    third_party/protobuf/src/google/protobuf/wire_format.cc
   2.1%   637Ki   1.7%   117Ki    third_party/demumble/third_party/libcxxabi/cxa_demangle.cpp
   1.8%   549Ki   1.7%   114Ki    src/bloaty.cc
   1.7%   503Ki   0.7%  48.1Ki    third_party/protobuf/src/google/protobuf/repeated_field.cc
   1.6%   469Ki   6.2%   427Ki    third_party/capstone/arch/X86/X86DisassemblerDecoder.c
   1.4%   434Ki   0.2%  15.9Ki    third_party/protobuf/src/google/protobuf/message.cc
   1.4%   422Ki   0.3%  23.4Ki    third_party/re2/re2/dfa.cc
   1.3%   407Ki   0.4%  24.9Ki    third_party/re2/re2/regexp.cc
   1.3%   407Ki   0.4%  29.9Ki    third_party/protobuf/src/google/protobuf/map_field.cc
   1.3%   397Ki   0.4%  24.8Ki    third_party/re2/re2/re2.cc
 100.0%  29.5Mi 100.0%  6.69Mi    TOTAL
However, Bloaty does not incorporate hardware memory limits defined in linker scripts, so it cannot report how close a firmware image is to exhausting a given memory region.
Puncover
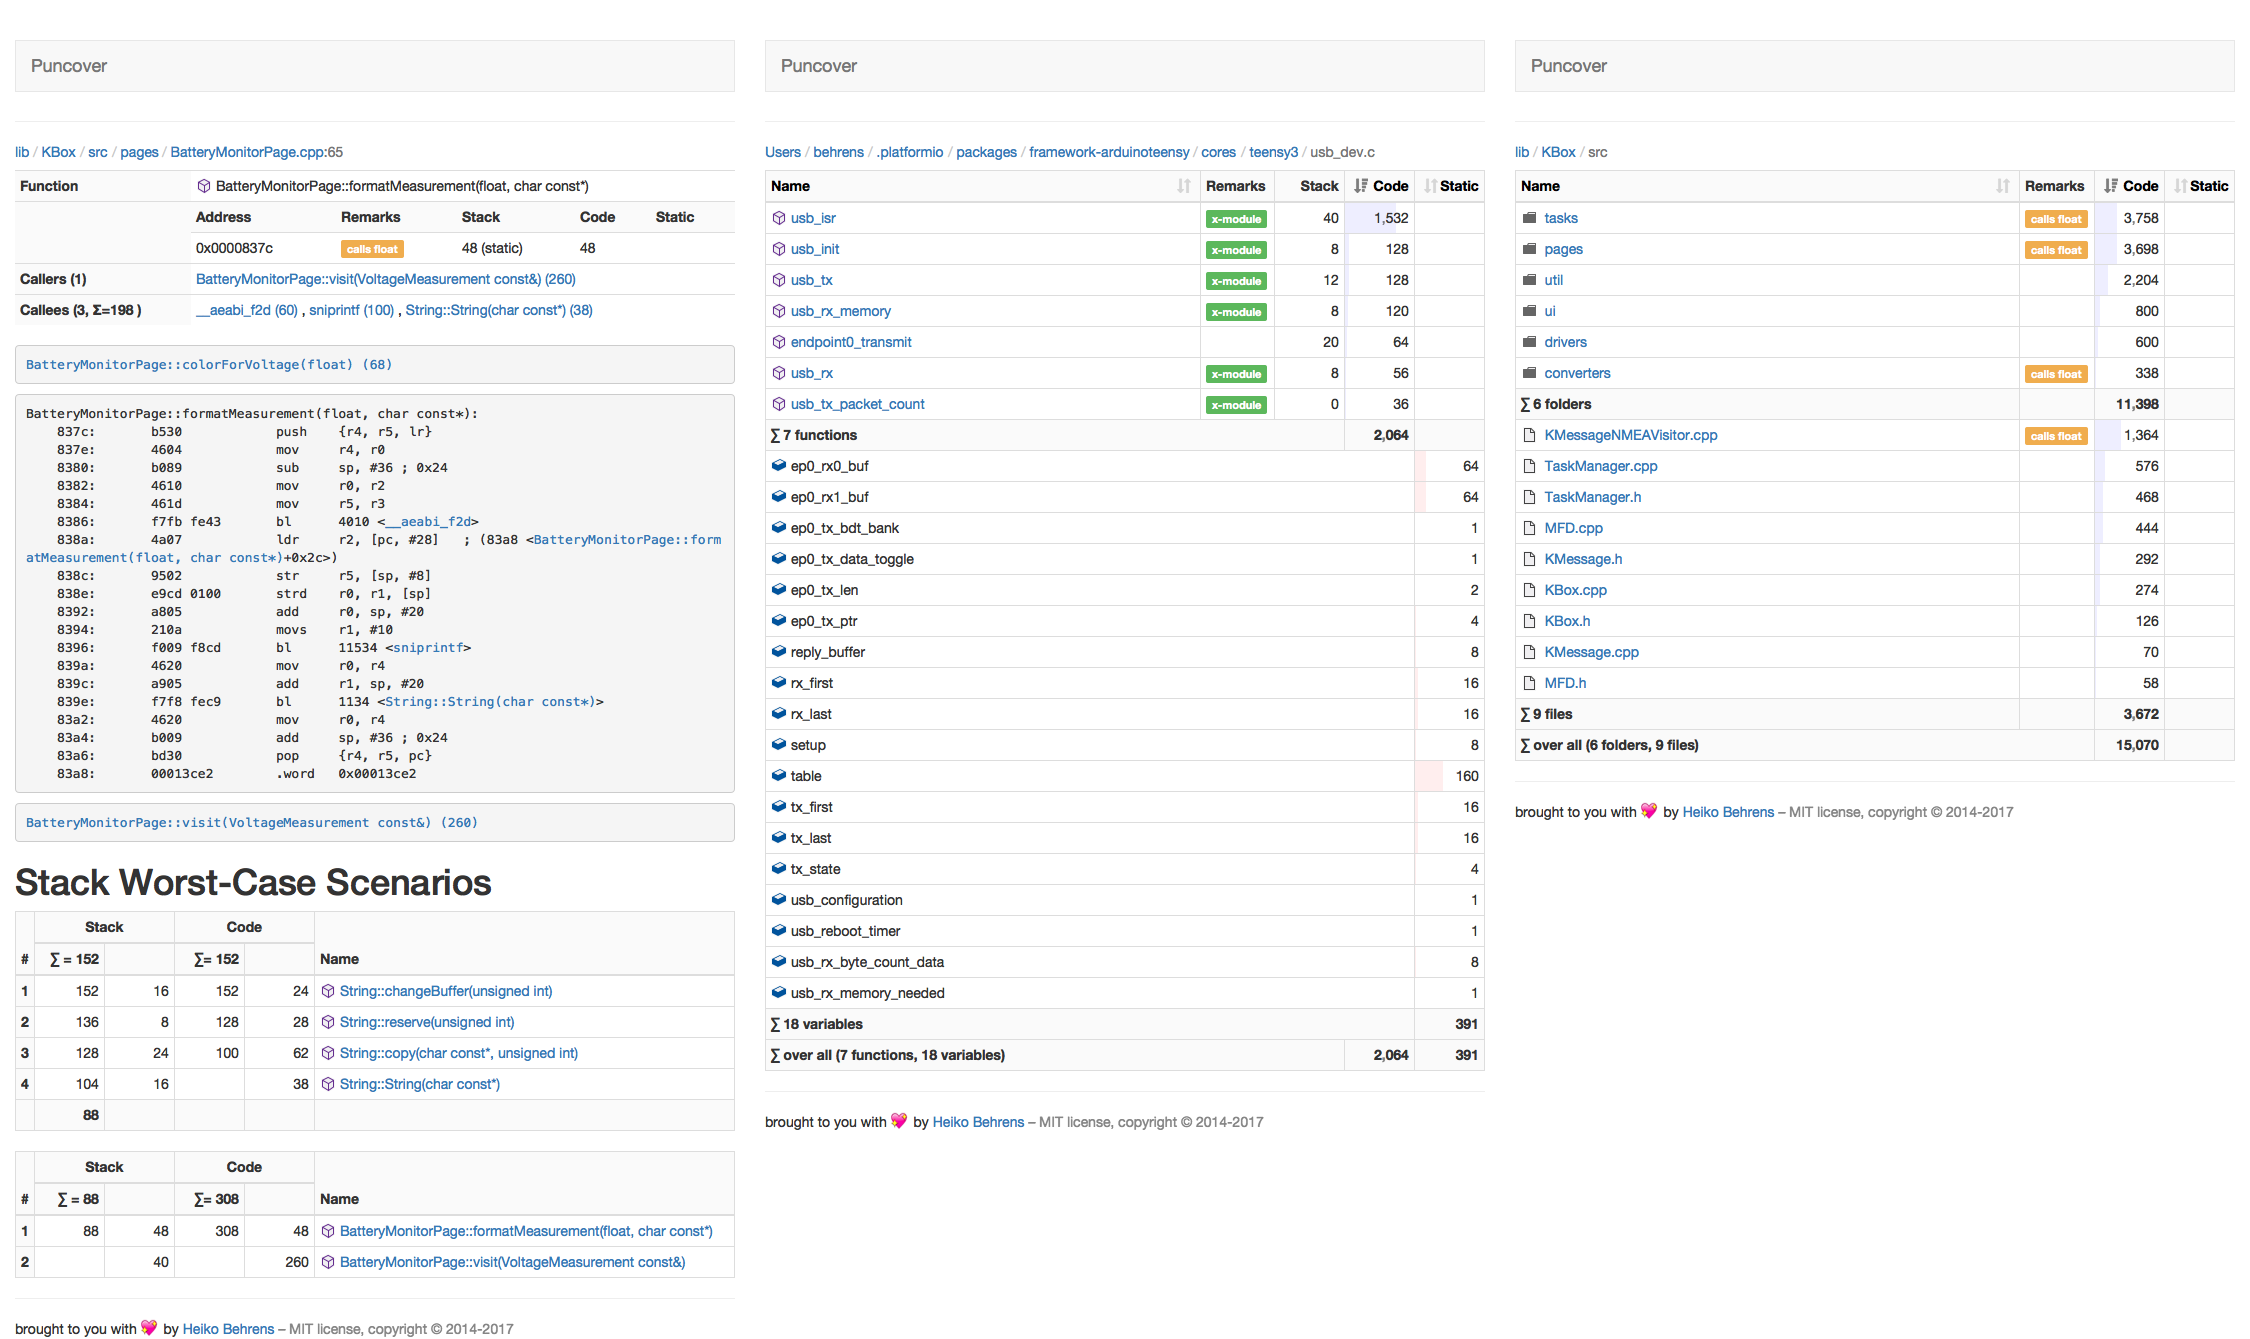
Puncover analyzes ELFs to get code size, static memory usage, and stack consumption. It generates detailed reports with disassembly and call-graph analysis, organized by directory, file, or function.
The results are presented via a local HTTP server with an interactive HTML interface, making it useful for deep, one-off investigations.
Limitations of One-Off Profiling
These tools are valuable for understanding the current memory footprint of a firmware binary. They are especially useful when diagnosing linker overflows or performing last-minute checks before a release.
However, comparisons are typically manual, ad-hoc, and limited to snapshots in time.
Continuous Memory Footprint Tracking
Beyond last-minute profiling, best practices call for continuous memory footprint tracking throughout development. Typical use cases include:
- Pull request reviews: understanding how a change affects memory usage across all supported targets before merging
- Feature validation: comparing estimated memory cost with the actual footprint of an implementation
- Trend analysis: tracking memory usage over time to predict future exhaustion and identify sudden regressions or spikes
Reducing manual work is essential: both to save engineering time and to avoid human error. Ideally, memory tracking should be repository-aware, automated, and tightly integrated into the CI pipeline.
Real-World Examples
MicroPython 
MicroPython is a Python implementation for embedded devices, delivered as firmware that runs on a wide range of microcontrollers. With many contributors and diverse targets, maintainers must carefully ensure that changes merged into the master branch remain memory-efficient.
MicroPython uses custom scripts to build firmware for multiple platforms, run the size tool on each build, and emit textual reports. A separate script compares two reports to compute memory deltas.
These scripts are executed via a GitHub Action (code_size.yml) on every pull request update. The workflow builds both the base branch and the PR commit across eight platforms, compares their memory usage, and posts a summary comment directly on the PR.
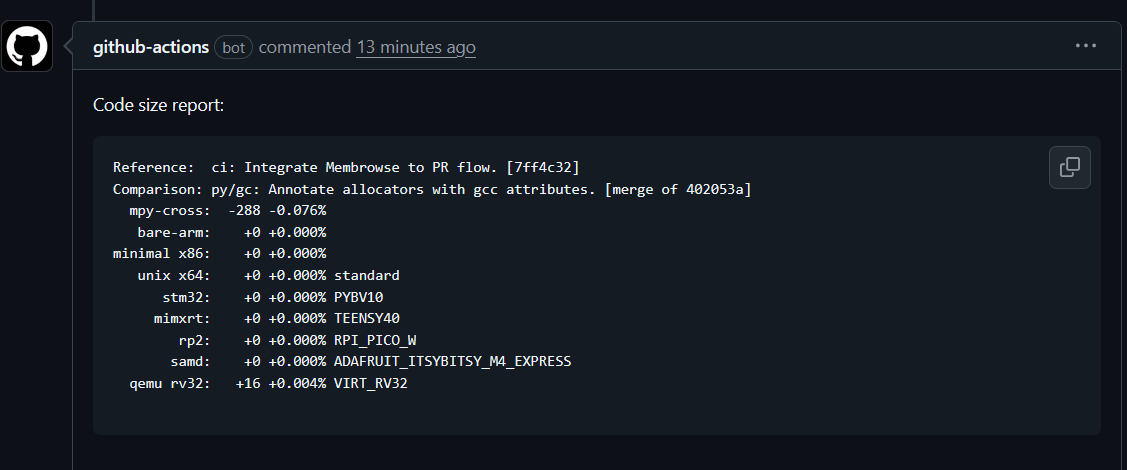
This is a lightweight and practical solution that allows maintainers to quickly assess the memory impact of a proposed change.
Limitations
- No memory usage trend tracking
- Not a CI gate: PRs cannot be automatically blocked based on memory regressions
- Limited granularity: reports show aggregate sizes, without section- or symbol-level attribution
- The size tool can be misleading as it doesn't take into account alignment padding between sections
Zephyr 
The Zephyr Project is a major real-time operating system (RTOS) used across the industry and backed by a large ecosystem of companies and contributors. Its scale and diversity of supported hardware make memory footprint tracking a critical concern for maintainers.
Zephyr maintains a centralized memory footprint tracking system that runs as a scheduled GitHub Action (footprint-tracking.yml). On a daily basis, this workflow builds a large set of reference targets, extracts detailed memory data including regions, sections, and symbols, and stores the results as structured JSON. The data is then uploaded to Elasticsearch and visualized through Kibana dashboards.
This setup provides maintainers with a global, long-term view of memory footprint trends across the project. It allows them to observe gradual growth over time, detect regressions introduced by recent changes, and investigate how memory is distributed across regions and components for a wide range of targets. In practice, this system functions as an internal observability tool for the project's overall memory health.
At the same time, the workflow is primarily designed for maintainers and long-term monitoring rather than for day-to-day development feedback. Comparisons between two memory layouts are possible, but they rely on separate scripts and are typically performed manually, outside of the pull request review process.
Limitations
- Not a CI gate and does not run on pull requests, so contributors do not receive immediate memory footprint feedback during review
- Memory dashboards are private and accessible only to maintainers
- Requires substantial custom infrastructure, including Elasticsearch, Kibana, and project-specific extraction scripts
- Difficult to reuse outside the official Zephyr repository, especially for downstream applications that build their own firmware on top of Zephyr
- Dashboard configuration is not version-controlled in the repository, making the setup hard to reproduce or adapt
 MemBrowse
MemBrowse was built to move firmware teams from one-off memory profiling to continuous memory footprint tracking.
Instead of relying on custom scripts, manual comparisons, or project-specific infrastructure, MemBrowse provides a structured and repeatable way to track firmware memory footprint across commits, branches, and multiple targets. It treats memory footprint as a first-class development signal, similar to test results or build status.
MemBrowse is composed of:
-
CLI report generator (available on GitHub) analyzes ELF files together with their linker scripts to generate a detailed and structured memory report. The report includes memory regions, sections, and symbols, and accounts for hardware limits defined in the linker scripts.
The MemBrowse CLI can be used standalone for local analysis, as well as for uploading reports to the MemBrowse platform. The tool is also integrated as a GitHub Action, available via the GitHub Marketplace. -
Platform (hosted or deployed on-premises) stores these reports and provides analysis and review tools, including:
- A time-series view to track memory footprint changes across commits
- A build comparison view that allows comparing any two builds, such as a pull request against the main branch or two consecutive release tags
- A symbol-level analysis view for investigating where memory is being consumed
- Memory budget configuration, where budgets can be defined per memory region and per feature. These budgets can be enforced as a CI gate, allowing pull requests to fail automatically when a memory budget is exceeded.
Features are associated using commit message keywords, enabling teams to reuse existing identifiers such as JIRA IDs or define custom keywords without changing their workflow.
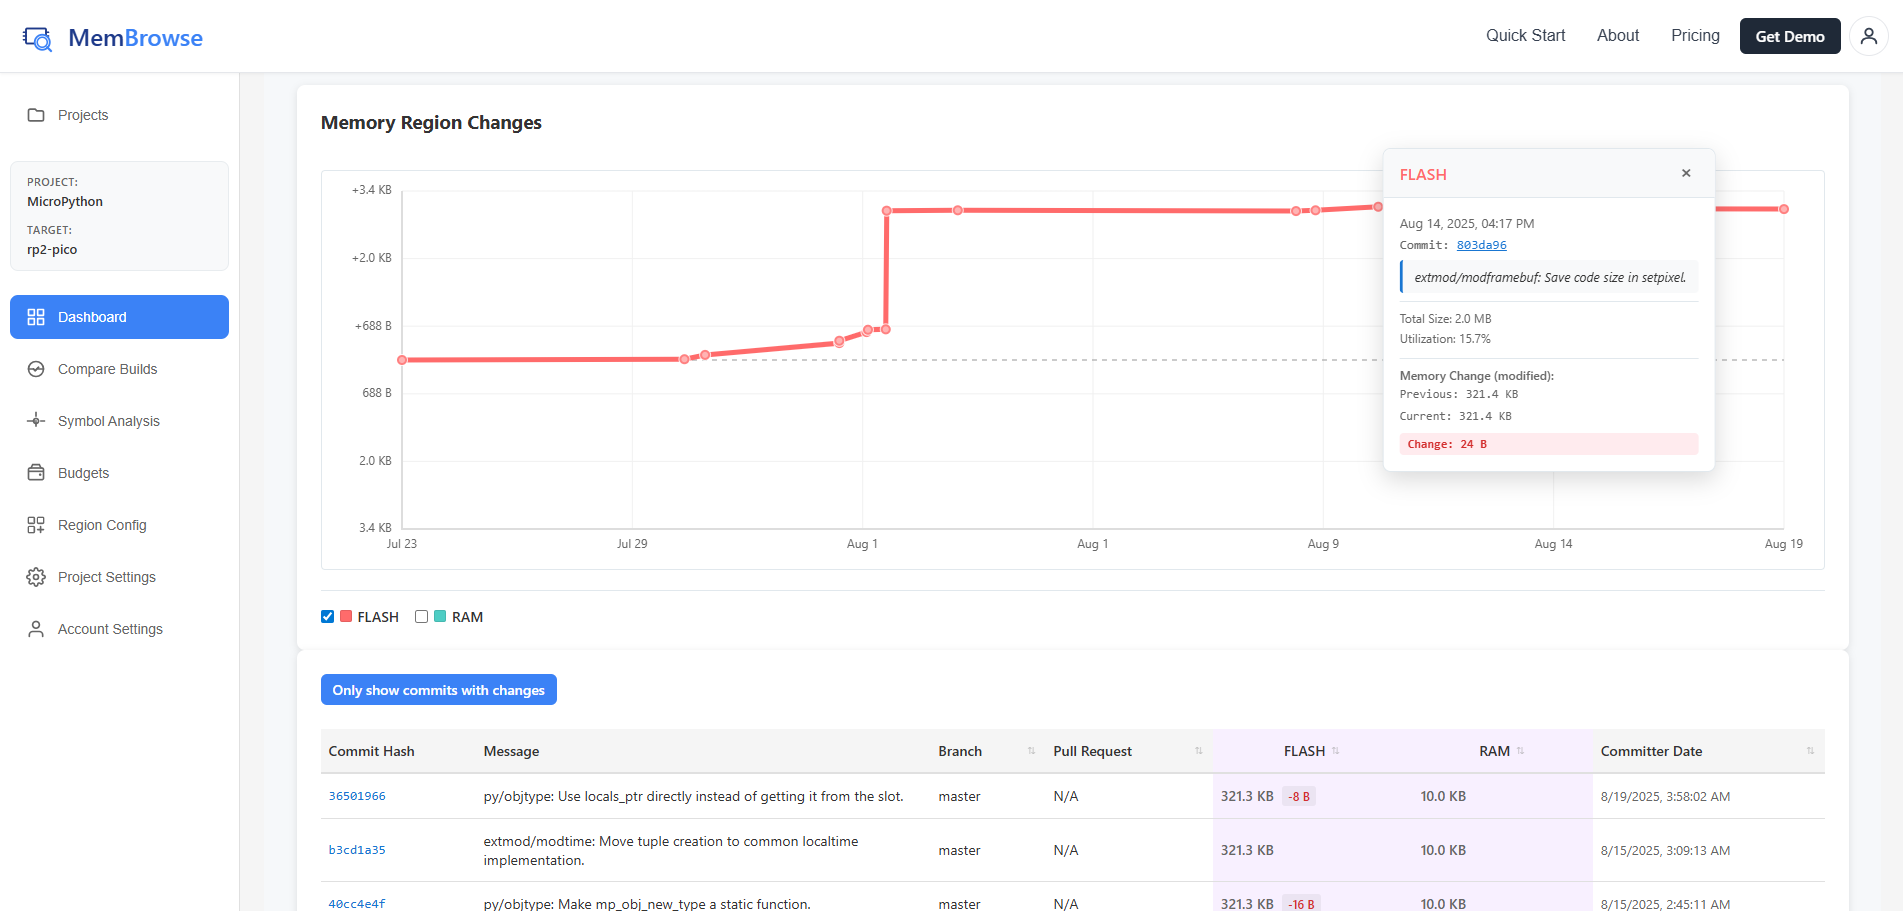
By separating targets, supporting arbitrary build comparisons, and making memory footprint changes visible during code review, MemBrowse turns memory tracking into an ongoing engineering practice rather than a last-minute diagnostic step.
The goal of MemBrowse is not just to measure memory footprint, but to make it visible, reviewable, and enforceable throughout the development lifecycle. Memory tracking should not be an afterthought, a side project, or a release-only check. It should be continuous, reliable, and easy to adopt.