ZSWatch memory audit
ZSWatch, created by Jakob Krantz, is one of the most complete open-source smartwatches out there: custom hardware designed in KiCad, a Zephyr-based firmware with its own app framework and LVGL UI, and a companion app alongside Gadgetbridge support on the phone side. Everything is public, the schematics, firmware and the app.
ZSWatch integrated MemBrowse into its CI. Once the build data was there, I ran a memory audit over it. I thought it would be interesting to share some of the findings and conclusions.
A project that already cared about memory
The watch runs on an nRF5340, with 1 MB of internal flash and 512 KB of RAM on the application core, plus 64 MB of external QSPI flash that the core can execute from directly (XIP). Internal flash is fast but limited. External flash is large but slower, and code there can't run while the QSPI peripheral is off. That's most of the time: running QSPI takes the current draw from about 200 µA to several mA, so it isn't practical to keep it on while the screen is off. Choosing what goes where is a real design decision.
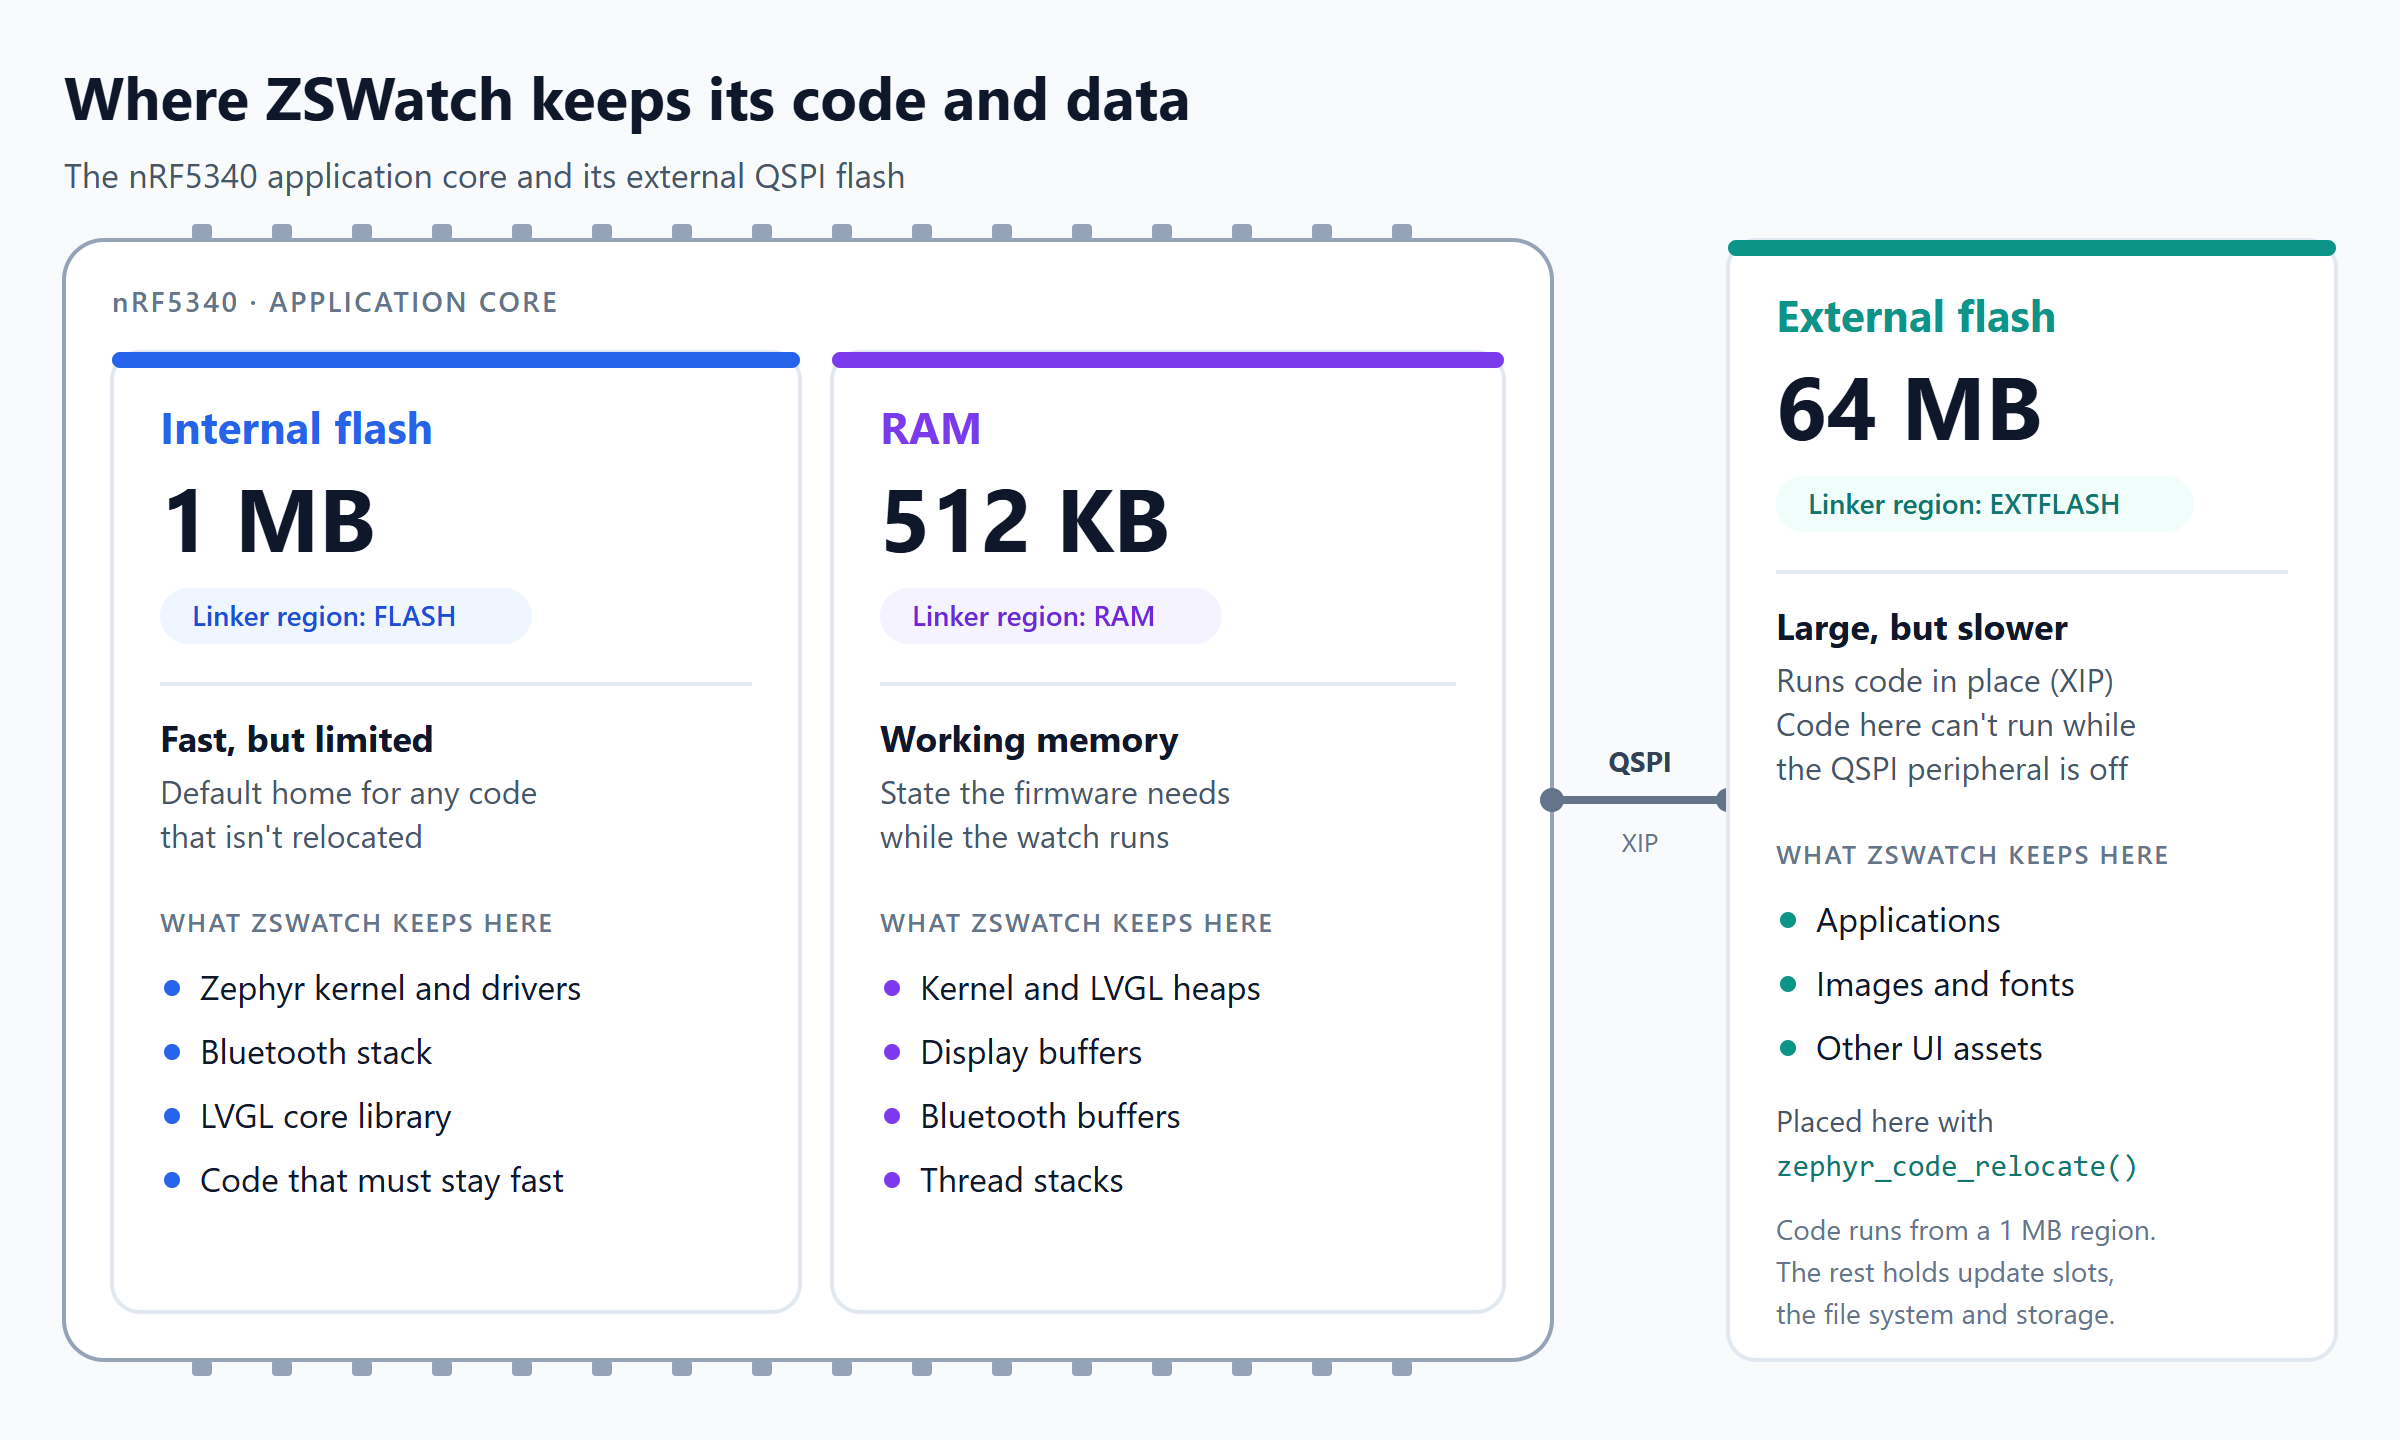
The three memories ZSWatch works with, what it keeps in each, and their region names in the linker script.
ZSWatch made that decision deliberately. Zephyr's code relocation (zephyr_code_relocate()) places the code and data of specific source files in a named memory region. ZSWatch uses it to put its applications, images and UI assets in external flash, keeping internal flash for what needs to be fast.
That's a big part of why the audit could produce precise results. The structure was already there, so the deviations stood out.
How the audit worked
MemBrowse tracks four ZSWatch targets built in GitHub Actions. After each build, the membrowse-action reads the ELF and linker script and uploads usage per memory region and size per symbol. Source code and binaries stay in CI, and the dashboard keeps the full history.
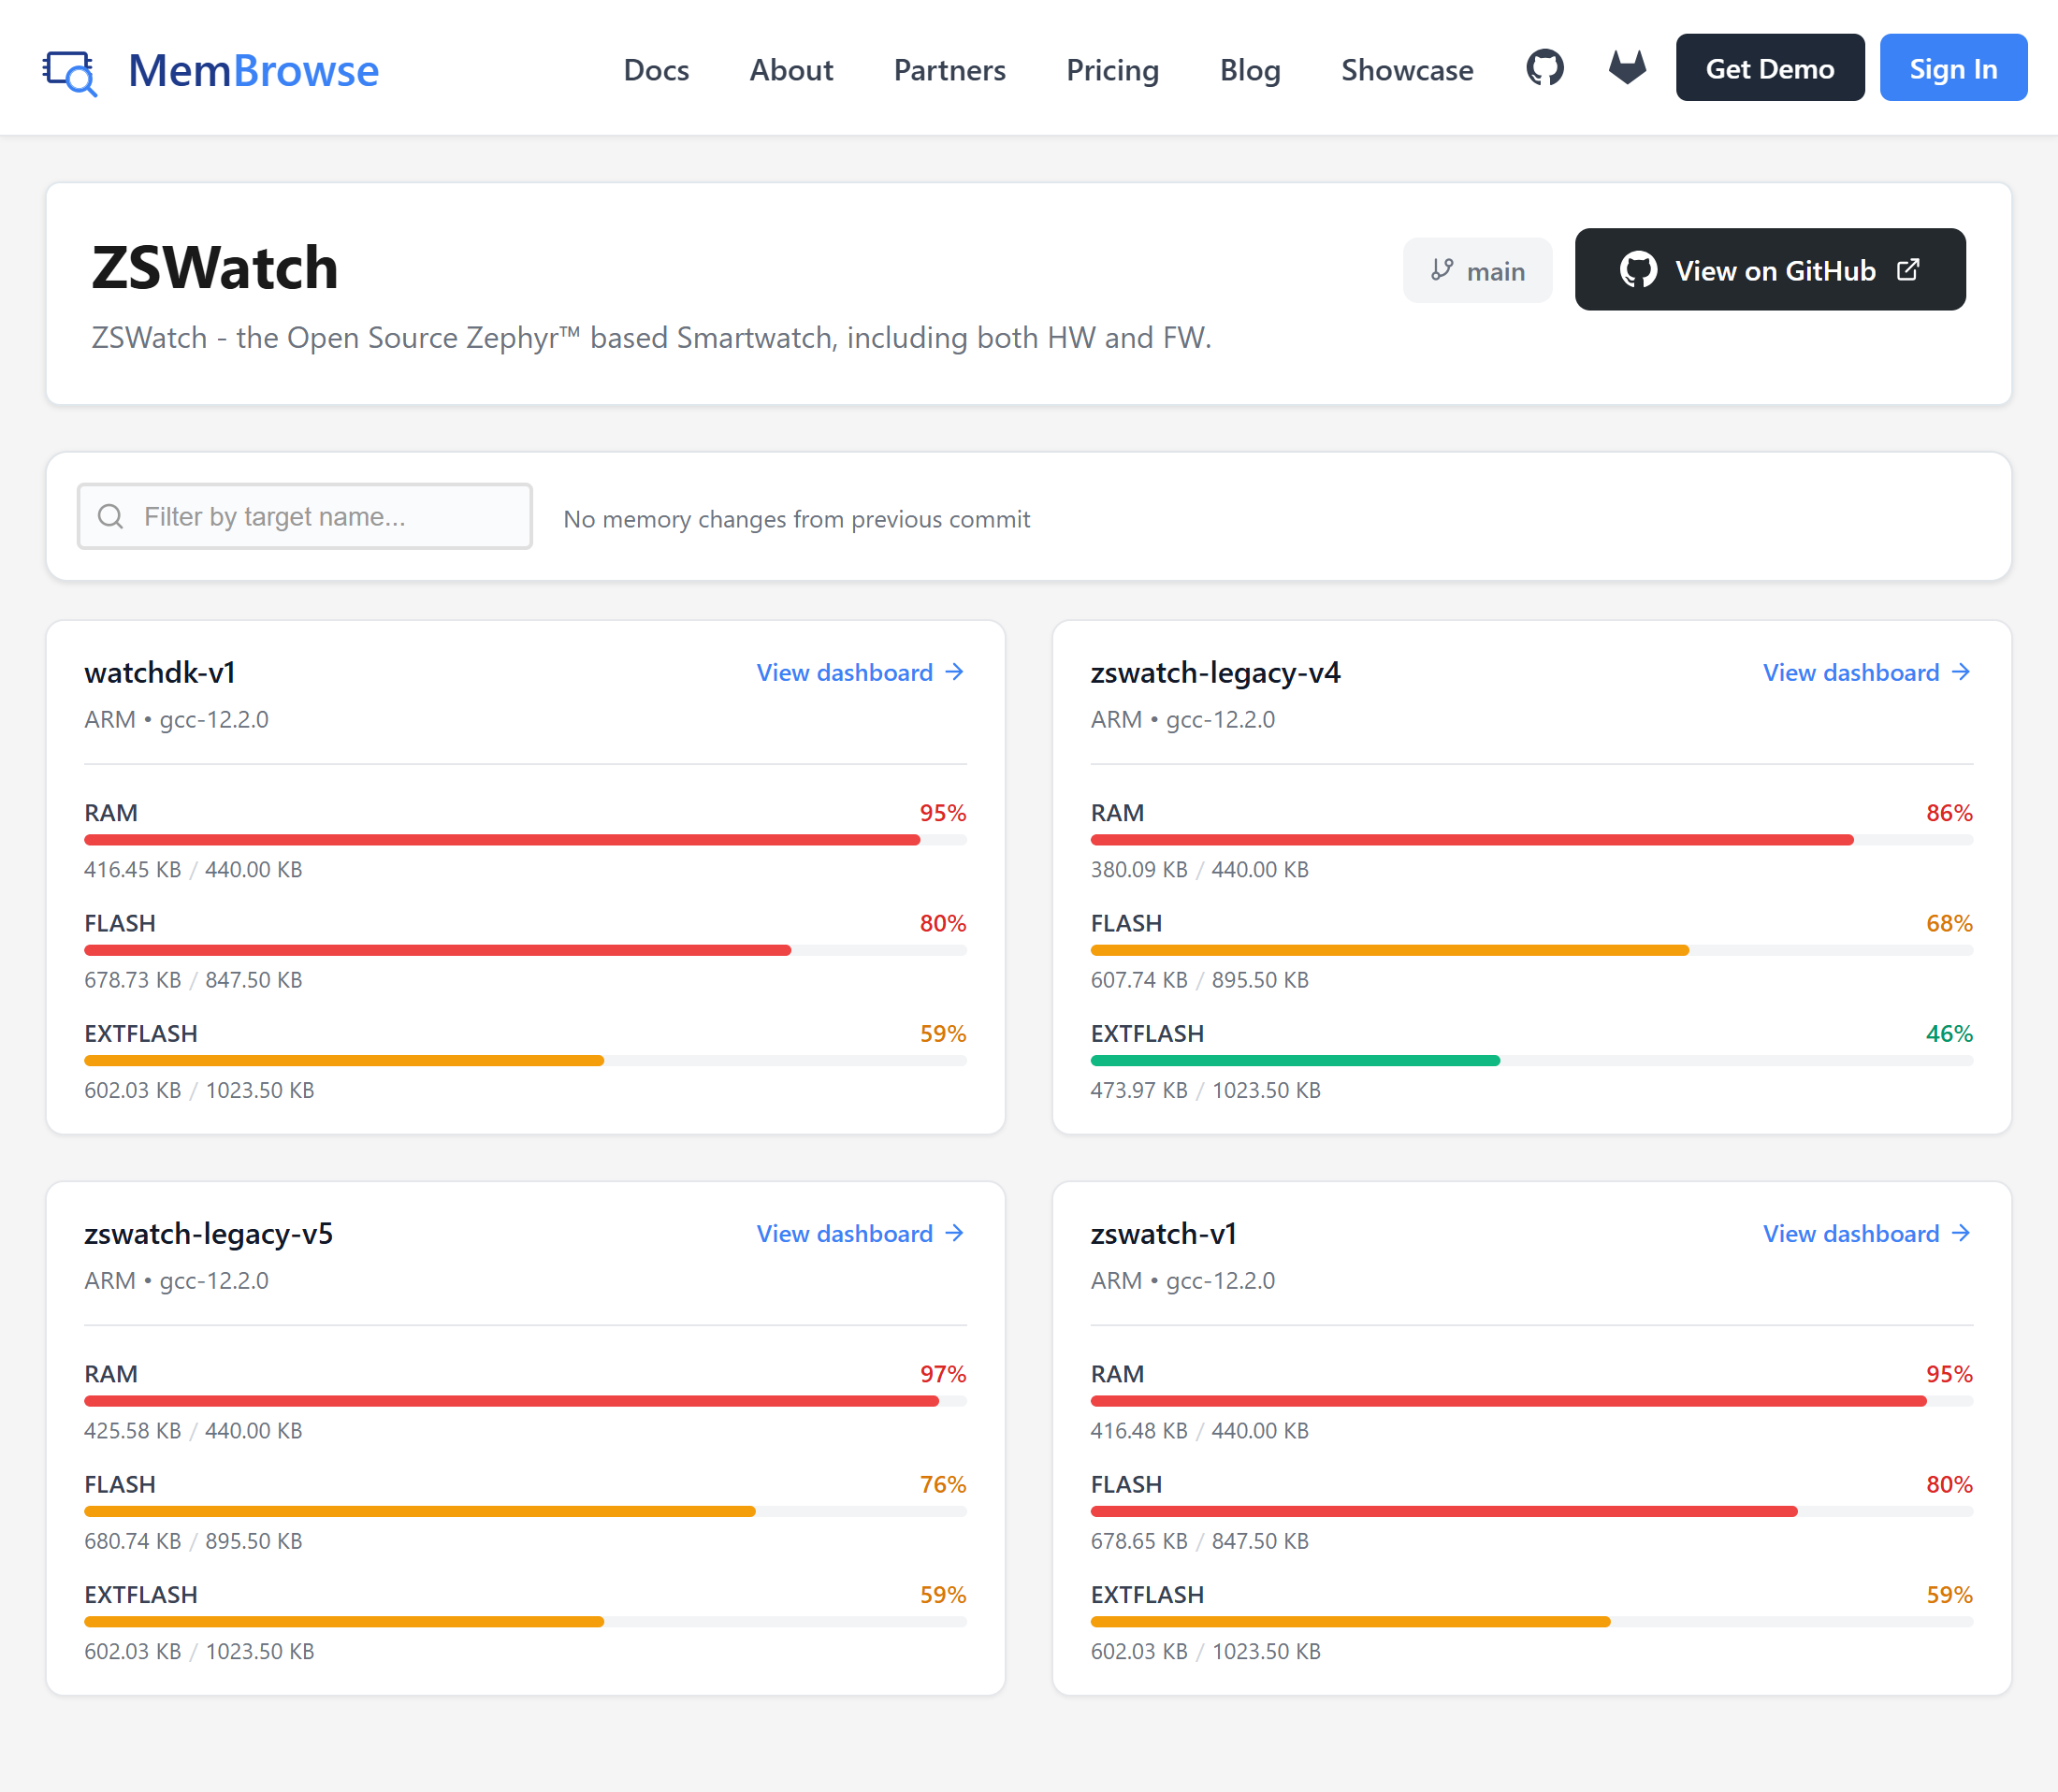
ZSWatch on MemBrowse: RAM, FLASH and EXTFLASH usage for each of the four targets.
The audit itself is done by an AI agent I built. MemBrowse's build data gives it the starting context: usage per region, size per symbol, and how both change across targets and over time. From there, the agent follows where the data points. It reads the source, including the CMake, Kconfig and devicetree files that decide where code ends up. It also walks the git history to find the commit that introduced or grew each cost. Most findings point to a file, a line and the commit where the cost came from.
The 74 KB
The biggest finding came from the agent's view of internal flash. Internal flash was 83% full on three of the four targets. The third-largest library in it was liblvgl_editor.a, at 74 KB, ahead of Zephyr's core library libzephyr.a. That stood out in a project that deliberately keeps its UI in external flash. None of the editor library was in external flash.
Listing the image symbols made the pattern plain. Every image from the app's own code sat in .extflash_rodata_reloc, the section that code relocation creates in external flash. The editor's icons sat in plain rodata in internal flash. Its fonts and code were in internal flash too.
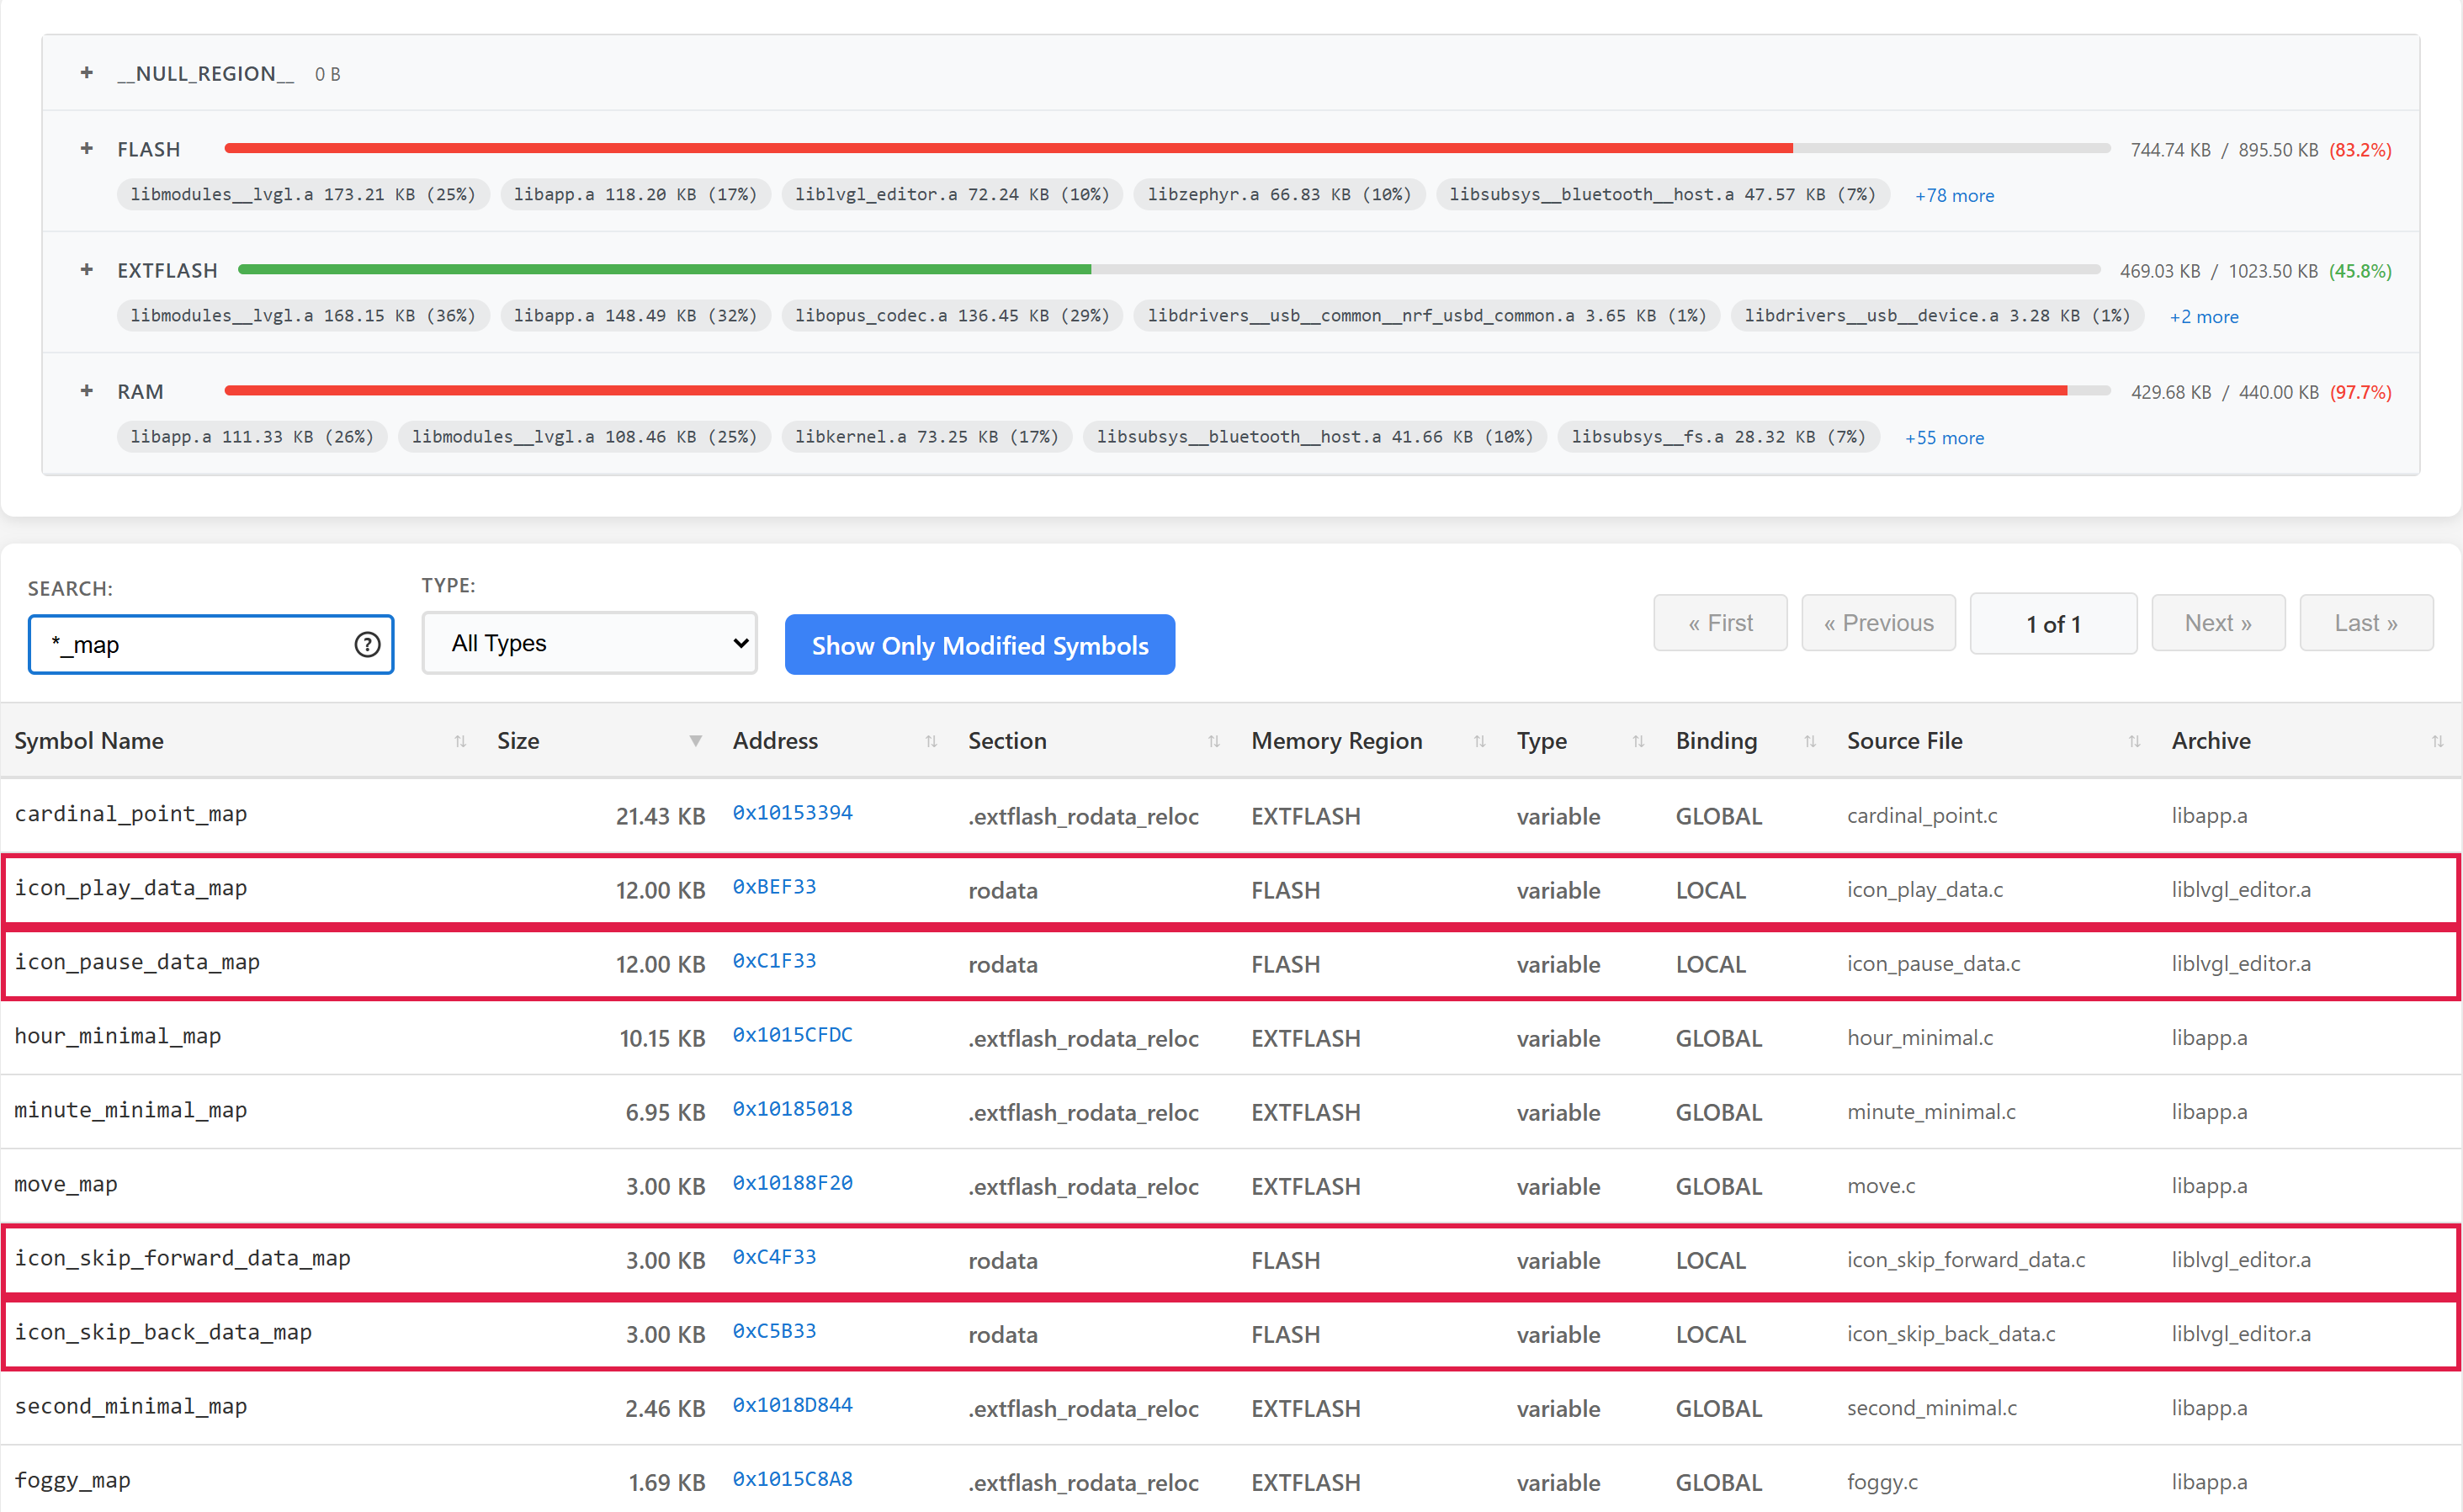
Image symbols in the build before the fix, on zswatch-legacy-v5. The editor's icons, outlined, are the only ones in internal flash. The region summary above lists liblvgl_editor.a as the third-largest library in FLASH. MemBrowse counts 1 KB as 1,024 bytes, so its 72.24 KB is the 74 KB in this post.
When one part of the UI ignores a placement rule the rest of the project follows, the cause is usually in the build setup rather than the C code. Here it was a CMake variable that was set but never read. app/lvgl_editor/CMakeLists.txt passed its sources up to the parent through a RELOCATE_FILES variable with PARENT_SCOPE, but the parent never used it. There was no error or warning. The files linked into the default region, which is internal flash. This is an easy mistake in a growing CMake tree, and nothing in a normal build shows it.
The fix (PR #590) calls zephyr_code_relocate directly in the editor's CMakeLists, the same way the rest of the project already did. On every target, about 74 KB moved from internal to external flash. Internal flash dropped from 83% to 75% on three of the four boards.
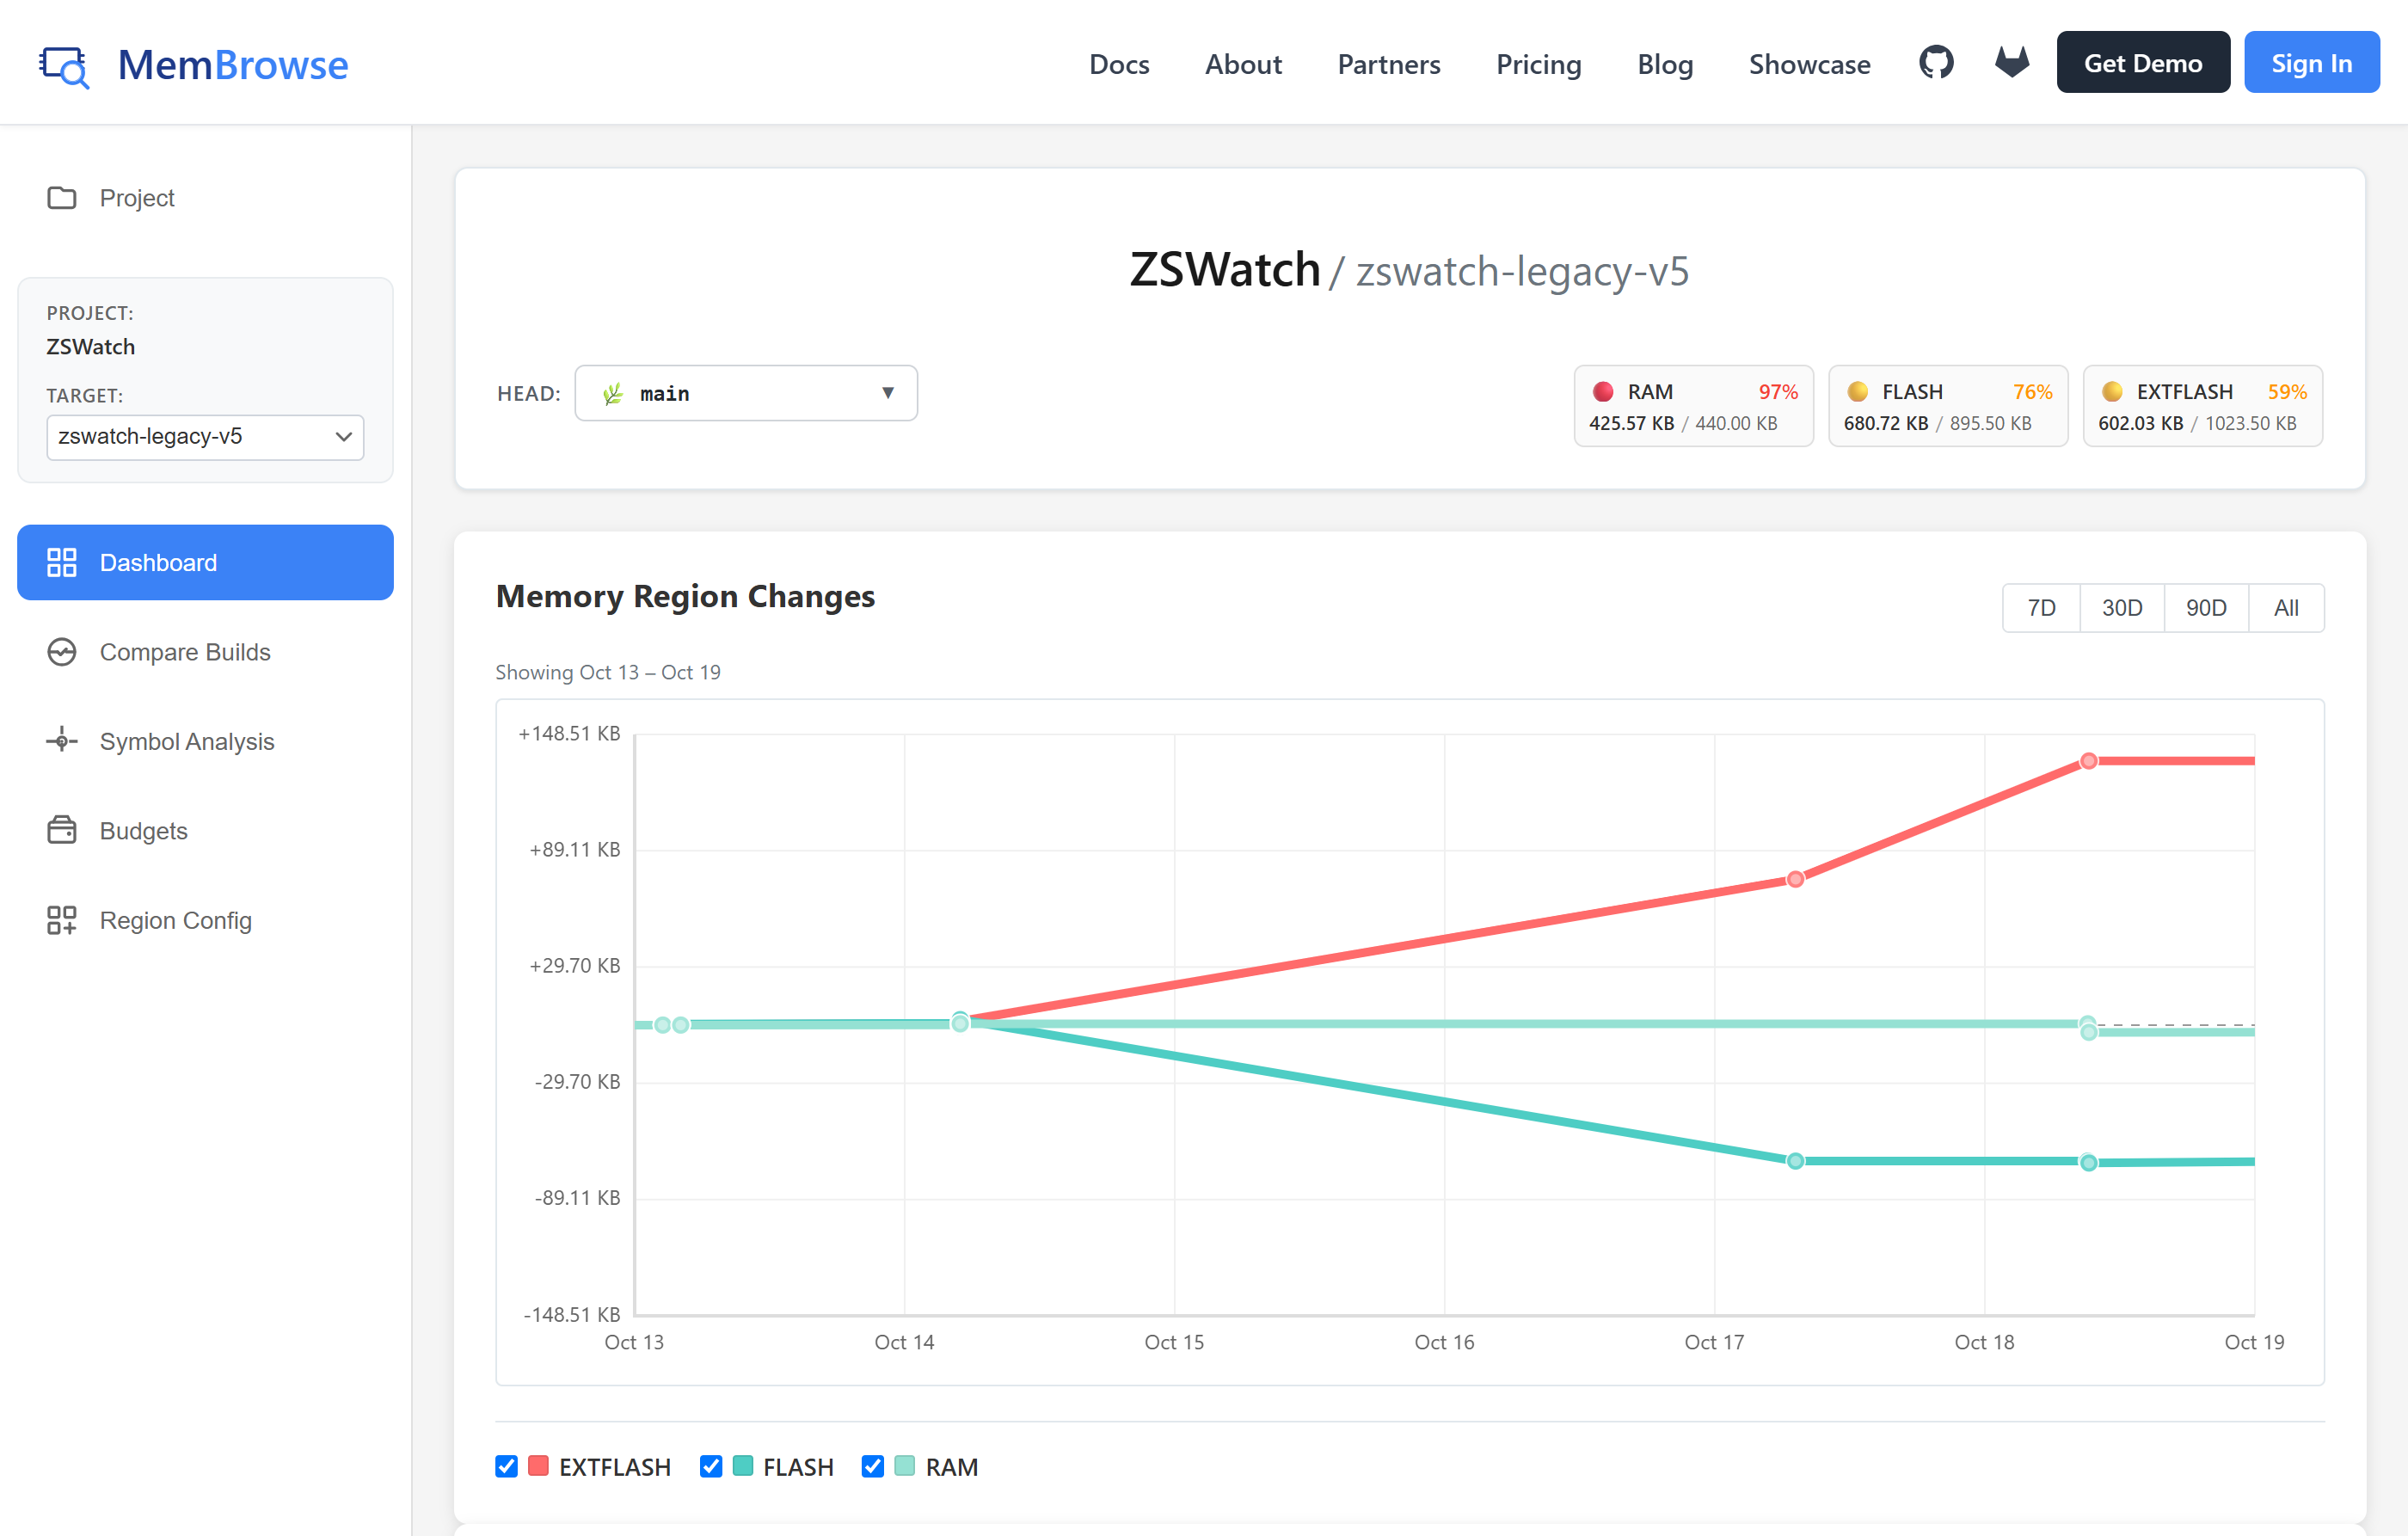
History for zswatch-legacy-v5, zoomed to October 13 to 19. When the fix lands on October 17, FLASH drops and EXTFLASH rises by the same amount. The second EXTFLASH rise on October 18 comes from a separate change.
Beyond the 74 KB
The editor library was the biggest finding, but it was one of 14 possible trims in the report. Like the 74 KB, the most useful findings aren't specific to ZSWatch. One is a Zephyr quirk, one comes with supporting several boards, and one applies to any C codebase.
A Zephyr quirk: relocated code isn't garbage-collected by default. zephyr_code_relocate marks relocated sections with KEEP(), so --gc-sections can't drop unused code in them. On ZSWatch, this kept an unused Opus decoder in external flash, about 21 KB. Passing NOKEEP to zephyr_code_relocate fixes it, and ZSWatch now does.
Multiple targets: board configs drift apart. Each board has its own devicetree overlay and config files, so a change has to be repeated for every board, and it's easy to miss one. Comparing symbols across targets shows it immediately. On ZSWatch, it found a serial shell that had been removed from three boards but was still enabled on the fourth.
Any C code: buffers passed by value instead of by pointer. When a struct carries its data in fixed-size arrays instead of pointing to it, every copy of that struct pays the full size. In ZSWatch, BLE events copy whole HTTP responses into 2 KB arrays, which made every event 4 KB. Pointing to the data instead would save about 11 KB of RAM.
Catching bloat in review
The audit cleaned up what had built up over years. What matters more is what happens from now on. Every ZSWatch pull request gets a MemBrowse comment that shows how it changes each memory region on each target.
That puts the memory cost in front of the reviewer, next to the code. Files that land in internal flash instead of external flash show up as FLASH growth. A buffer that doubles shows up as RAM growth. A config change that reaches only one board shows up on that board alone. Each of these gets caught before it merges, not months later when the build runs out of room.
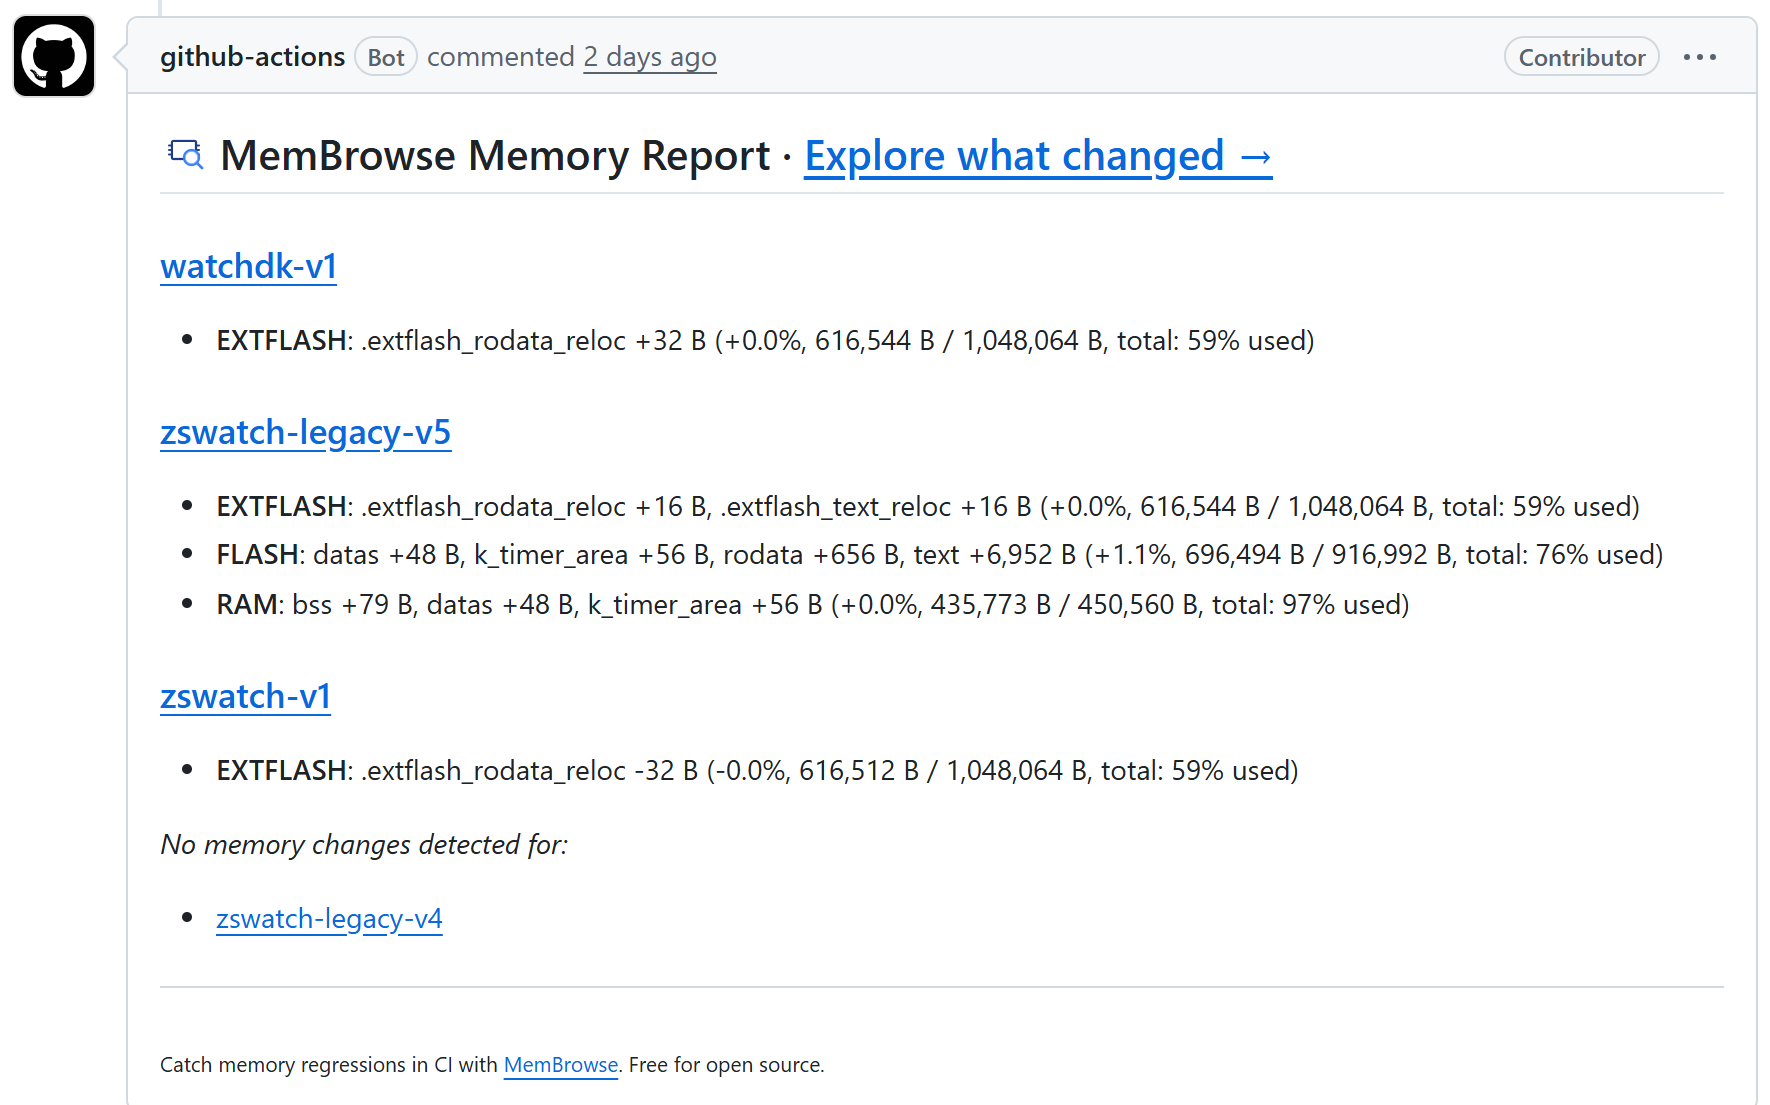
The MemBrowse report on a ZSWatch pull request that changed only the legacy-v5 board. Its 7.5 KB of FLASH growth shows up on that target alone.
Thanks to Jakob for being open to the integration and the findings. ZSWatch's dashboard is public: membrowse.com/public/ZSWatch/ZSWatch. MemBrowse is free for open-source projects. If you maintain a Zephyr project and want to see your own data, write to me at michael@membrowse.com.